
Greenland's Ice:
Dramatic Meltdown
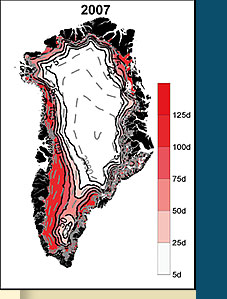
Newly published research, which includes satellite data from three separate sources, shows that the seasonal melt on Greenland’s ice sheet during the summer of 2007 was the highest yet recorded—and a stunning 60 percent greater than the previous high, set in 1998.
 “What we found was really quite remarkable,” said study author Thomas L. Mote, a University of Georgia climatologist. “This work includes the longest satellite record that anyone has for Greenland,” including information from as far back as the early 1970s. “No one piece of evidence ever tells the whole story,” he added, “but when you put them together, they point in the same direction.” Mote’s research was published in the November 2007 issue of Geophysical Research Letters.
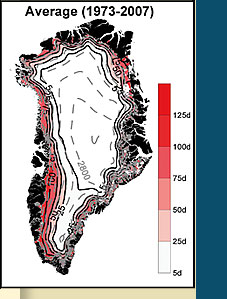
Perhaps just as dramatic as the huge increase in snowmelt were the study’s findings that Greenland had as many as 50 more days of melt than average and that the melting season began a full month earlier. Mote, who is associate head of UGA’s Department of Geography and director of the Climatology Research Lab, has studied snowmelt in Greenland for more than a decade, but even he was unprepared for the dramatic increase of last summer.
Mote compared data from three satellite sources:
- The Special Sensor Microwave/Imager (SSM/I), which provided information from 1987 to present
- The Scanning Multichannel Microwave Radiometer (SMMR), which supplied data from 1979 to 1987
- The Electrically Scanning Microwave Radiometer (ESMR), for data recorded in 1973, 1974, and 1976.
While other researchers had used data from the SSM/I and SMMR, none had re-examined the older information generated from the ESMR satellite, and the longer record allowed Mote to see farther into the Greenland ice sheet’s history.
Just why the huge increase in melt occurred this past summer is not yet entirely clear, said Mote, though elevated surface temperatures certainly contributed to it. Coastal meteorological stations showed higher-than-average temperatures for most of the season. But another culprit may have been changes in the structure of the ice sheet itself.
Data show that the average number of melt days has been steadily increasing since 1997, and this may have allowed the ice sheet to become more susceptible to further melting. Large streams of water actually flow through chasms and cracks down to the land’s surface and cause the ice sheet to become unstable. Other possible mechanisms, said Mote, may include an increase in temperature of the snow or less snow accumulation in recent years.
He points out that the noticeable summer melt of ice in Greenland is consistent with satellite observations that have pointed to decreasing amounts of sea ice across the Northern Hemisphere since 2000.
“The most recent Intergovernmental Panel on Climate Change assessment report concludes that changes in surface melting have contributed to a loss of mass in Greenland,” said Mote, “which they report is ‘very likely’ a contributor to global sea-level rise.”
For more information, contact Thomas L. Mote at: tmote@uga.edu
 |